Two years have now passed since the start of the pandemic, many of you will have seen myriads of graphs and numbers, believing that you are therefore current informed about the situation. However, none of the main information channels has ever summed up and really compared both scenarios we experienced. In this way a covid comparison is even more necessary.
It is therefore time for a correct covid comparison to let the numbers speak for themselves, always keeping in mind at least two fundamental evaluation elements:
- Numbers are not the truth, because those who have the power to supply them write them;
- Those who supply them are not exempt from conflicts of interest.
The following study, concerning Italy, was carried out by collecting the data made available by John Hopkins University, therefore they are easily verifiable by anyone.
Covid comparison: limitations of the study
Since this is a purely statistical work, it should be emphasized that, like all studies in the medical field, the variability of the object under examination provides results of poor correspondence and reliability in a general sense. Climatic factors, ethnic variables, physical variables of people affected by the virus, vaccination mix of those affected, variance of circulating viral epitopes, are all factors that can alter the comparison of the results that the tables will show us. For this reason it will be difficult to ascertain with certainty both the merits of the unmentionable drug and the demerits of the virus.
Italy Monthly Cases
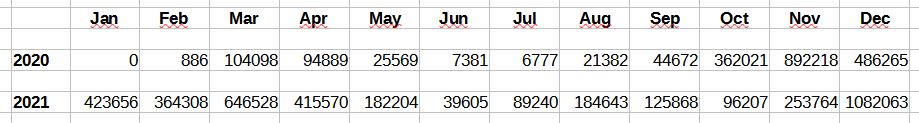
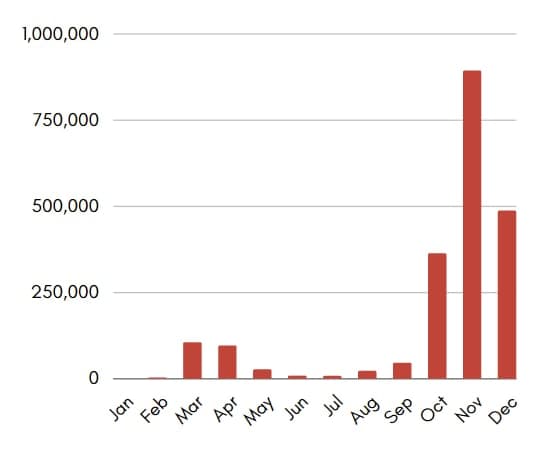
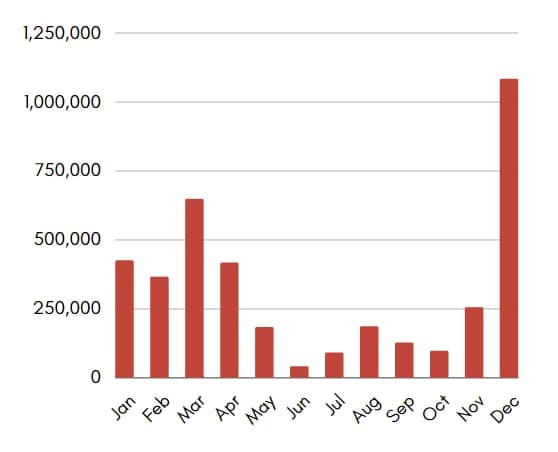
From the comparison of the cases detected, we can see in both years a significant increase that occurs regularly in the last quarter of the year. The phenomenon is mainly concomitant with 2 events that are repeated cyclically:
- The flu vaccination campaign, which is often accompanied by pneumococcal and other unmentionable drugs;
- The Christmas and New Year holidays.
The immunosuppression that follows each vaccination has a duration that varies from individual to individual, in relation to the reactivity of each and to the presence or absence of immunosenescence. Generally, the time needed to restore the correct lymphocyte picture can vary from one to several months. The older sections of the population are also those most subject to this type of problem which can often last longer than necessary. In this regard, the impressive variation of October / November 2020 is striking, in which it abruptly goes from 44672 cases registered in September to 362021 in October and 892218 in November. This figure is the highest ever recorded, second only to that of December 2021 which, however, sees an Italian population with vaccination coverage well over 75% necessary to achieve the initially promised herd immunity.
Overall, 2021 ends with 3.9 million cases against 2.04 million in 2020, however it is also necessary to note the enormous disproportion of the tests carried out in the respective years.
At 31 December 2020, the total number of tests carried out amounted to approximately 26.6 million, while 2021 closes with a total of 113.5 million tests, or 4.2 times those of 2020.
Covid comparison: first two conclusions
- Although the media keep telling us that the new variations are more transmissible than the original virus, in reality the opposite is true as the swab / case ratio is 0.076 for 2020 versus 0.035 for 2021;
- Those unmentionable drugs cannot be the cause of this slowdown because they are unable neither to prevent contagion, nor to prevent the spread of variants.
Covid comparison: identification of the relationships between cases
Now let us analyze what relationship exists between cases, doses and deaths, also observing the data in relation to their percentage increases.
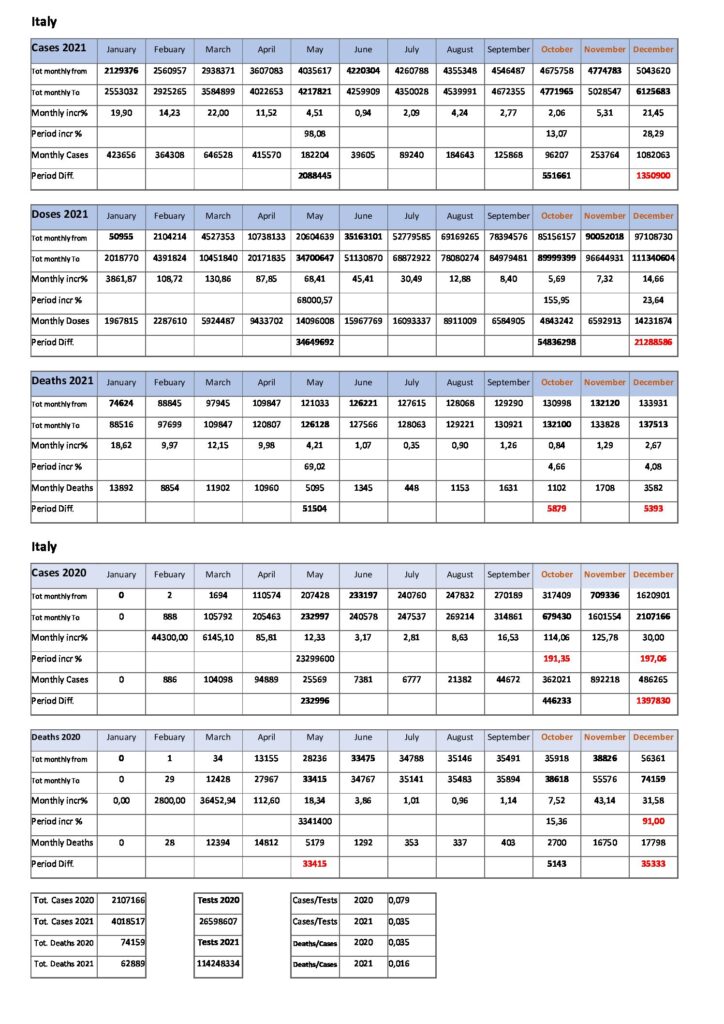
Brief presentation of data before analysis
The first two lines report the number of events recorded, which can be cases, doses or deaths, on the first and last day of each month. The third line concerns the percentage increase of events that occur in each month. The fourth line instead shows the total percentage increases that occurred in the first two sections of 5 months and in the last two months.
It is possible to note, highlighted in bold, the numbers that identify the beginning and the end of the reference intervals.
The fifth row reports the monthly differences between the starting and ending number of events reported in each month. In essence, this data builds the real profile at the percentage variations shown in the upper lines. In fact, you will notice that since the data starts from the value 1, the first increments are of enormous proportions. Then, as the months go by and the number of events grows, the percentage variations become smaller and smaller, so one could mistakenly believe that a given phenomenon is disappearing.
Line six shows us the difference in events that occurred in the same three time intervals previously examined. The last three mirrors at the foot of the tables report the final results achieved in 2020 and 2021 in terms of total cases, total deaths, total tests, and the final ratio between: tests and cases, cases and deaths.
COVID comparison – data analysis relating to the year 2020
2020, the year of the onset of oropharyngeal molecular tests, more than of the pathology, whose true origins are still poorly defined, sees a rapid increase in “covid” cases and deaths. This phenomenon will last for a very short period of time.
Observing the tables we note that March and April 2020 recorded almost one hundred thousand cases each, while already in May the cases decreased sharply to only twenty-five thousand. Considering that May 2021 alone has totaled 18,200 it is hard to believe that things with those kind of unmentionable drugs have improved; but this huge gap is due, as already mentioned and as we will see later, mainly to the disproportionate amount of tests carried out in 2021 rather than to an increased infectivity of the virus.
Summer 2020 passes quietly, however in September we already notice a timid awakening of the infections. In fact, at that time the intention of the government of the incumbent Prime Minister Mario Draghi and of the Civil Protection became known to reach the diagnostic capacity of 400,000 daily tests by the year. In fact, September reports 44600 positive cases against 21382 in August, however October will be the real surprise, the month of flu prevention.
The Pentagon study covered up to make way for a common narrative
Before continuing, it should be remembered that a controversial study by the Pentagon, announced on 12 March 2020, highlighted how, in the statistical sample observed , made up of active-duty military personnel, coronavirus infections were 36% greater in the flu vaccinated group than in the control group. The work was somewhat discredited and archived by the mainstream news network, despite also showing a 51% increase in human metapneumovirus, a virus that is initially characterized by infecting the lower respiratory tract, usually where covid patients develop bilateral pneumonia. . Taking these warnings into account, the flu vaccination should not have been carried out, since, in October 2020, in full covid19 epidemic, it would have been silly as well as useless. In fact, at that time, more newspapers were claiming that covid had “killed the flu”, not only in Italy, but throughout the world. Unlikely explanations were improvised, one more foolish than the other, but honestly in biology this statement is beyond a simple lie. Technically, viruses are not even alive, they are at most defined as “undead”, basically they are nothing more than sequences of DNA or RNA coated with a protein shell capable of interacting with other living biological entities, or those that all possess the structures able to read their information, therefore bacteria or eukaryotic cells, and to replicate them. They certainly don’t destroy other viruses. Given this brief consideration, someone will have to explain to us what happened to the flu.
In October 2020 there is therefore a predictable and drastic surge in cases. In fact, it goes from 44672 cases in September to 362021. The tidal wave gains strength and reaches its peak in November, touching 892218 cases and then declining to 486265 in December. Overall, in the last 2 months of the year there was an increase in cases of 197% compared to all cases collected in the previous ten months. Certainly the fault of the greater number of swabs put in place as scheduled, of course, but did flu prophylaxis really have no role in all of this?
Let’s try to answer this question. Normally what follows a viral or bacterial infection, or an inflammatory stimulus caused by a unmentionable kind of drug, is the phase defined as lymphocyte clearance and the simultaneous predominance of anti-inflammatory cytokines necessary to repair cell damage. Lymphocytic clerance occurs at the level of the Thymus, a primary lymphoid organ belonging to the immune system with endocrine gland functions, subject to senile atrophy. This phase is necessary to eliminate all the excess lymphocytes and the most harmful ones, in order to bring the immune system back into homeostatic balance. As previously mentioned, it is a long process, during which anti-inflammatory cytokines induce immune depression, which is in turn necessary for the correct repair of the body and to prevent possible destructive inflammatory recurrences. In this period of time, the neutralizing antibodies, developed following the resolution of the disease, will protect the individual from reinfection for the same pathogen, but at the same time they can make him more vulnerable to immune insults of other origins, being temporarily under-regulated the cellular response. . This phenomenon just described also happens in cases of stroke. In fact, those affected by this pathology are more susceptible to infections precisely because their body constantly releases anti-inflammatory cytokines in a desperate attempt to repair the damage suffered. For further information see eg. this important study from Pubmed.
On the 2020 death front, we have a trend that is very similar to the epidemic data, however it is necessary to keep in mind two distinct factors that can distort the meaning of the data:
- Half of all deaths in 2020 occur in the first two months of the pandemic.
- Wrong care protocols, initially applied in hospitals, result in more deaths than they should. In turn, the patients arrived at the hospital in desperate conditions due to the incorrect home care protocols “suggested” by the Italian government.
In fact, in the first 5 months of 2020 we observe 33415 deaths; however this number is essentially due to March and April. As of May, only just over 5,000 victims are killed. Victims of covid or wrong treatment?
The following five months, therefore from June to October, are added another 5143 victims of which October alone, the month of flu prevention, counts more than half, as many as 2700. Only 403 were the victims of the previous month, or seven times in less. Once again we note, as seen for the cases, that the warm months are again the usual two, this time in the second part of the year, namely November and December. In the last two months of 2020 there was an increase in deaths of 91% and a total of 35,333 deaths.
It is quite evident that despite eight months of therapeutic refinement, clinical practice and repeated mutations of the pathogen towards less lethal forms, a third factor seems to have actually increased its lethality. Among these factors, the vaccinations in October are not to be excluded, which are not limited to the flu prophylaxis alone, but also include other kind of unmentionable drugs, or the manipulation of data, in the strict sense of cataloging deaths.
From this first part of the covid comparison for the year 2020, the general impression obtained from the phenomenon is that COVID19 may be the antibody dependent enhancement (ADE) of various respiratory diseases, converging in a common path from the clinical aspects of the whole. superimposable, because they derive from the same type of immune dysregulation. Hemophagocytic lymphocytosis and lupus erythematosus may be the pathways induced by the massive vaccination campaigns. Both have an extreme similarity to severe covid19 syndrome, both in terms of many clinical parameters such as hyperferritinemia, high d-dimer values, cytokine storm mediated by the same interleukins, and also in symptoms such as the famous multiorgan damage. In lupus, for example, which is an autoimmune disease, the kidneys can also be involved, with obstructive phenomena at the level of the renal glomeruli, essentially due to the excessive accumulation of antigen-antibody immune complexes, which can lead to renal block, just as observed. in some cases covid19.
COVID comparison – data analysis relating to the year 2021
If in 2020 everything seemed to turn for the worse, 2021 starts under a lucky star thanks to the brand new mRNA and adenoviral vector drugs that boast 95% efficacy. More or less this is the message that has reached the masses.
In fact, the well-known clinical trial (one and two) of the P*****, as well evidenced by the numerous conferences of the excellent Dr. Peter Doshi, reported its efficacy to the Wuhan virus alone in 2019. The unmentionable drug was tested only on healthy subjects, no elderly, no pregnant women, while the children were negligible in number. Basically it was tested on a sample of people for whom the mortality from covid19 is zero. Although the statistical sample was based on a study group of only 38,000 volunteers, some deaths and numerous adverse reactions were recorded in the trial. Reassuring news, only 2 deaths out of 19,000 unmentionable drug group, meanwile 4 out o placebo group, not related like ever. Overall the total number of life treatenings was also higher in the placebo group, encouraging, 21 for vaccinated group, 24 for placebo group, quote:
“For the subset of 19,067 participants within the 37,586 group who had at least 2 months of follow-up after Dose 2, the numbers of severe or life-threatening AEs were consistent with what was seen in the 37,586 participants with 1 month of follow-up after Dose 2. Overall, in the 19,067 participants, from Dose 1 to the data cutoff date, 1.1% and 0.1% of participants in the BNT162b2 group experienced at least 1 severe AE and 1 life-threatening AE, respectively, and 0.7% and 0.1% of participants in the placebo group experienced at least 1 severe AE and 1 life-threatening AE, respectively. The results by age group were also similar”
It was an elegant way to minimize the gap between the two groups in terms of side effects. The placebo was not salt water, but another safe traditional drug, the one for meningitis. By acting in this way they have also irreparably shattered that bit of confidence that remained in the most tested ones; 26 life threats out of 18,000 participants meant 1 in 692 doses.
The United States today, January 2022, is permanently the country with the highest number of deaths per million inhabitants, and counts about 6 a day. There is talk of 1 case for every 166,000 inhabitants, compared to 1 in 9500, which means 105 not related deaths per million in 60, or 1,75 a day. To these 105 it will then be necessary to add those who will die of disease anyway..
The premises are certainly not the best, so let’s see in detail.
The 2021 cases begin immediately with double-digit monthly increases, from January to April, and then decline once again in May with an increase of 4.5%. Overall, the period January – May sees a total increase of 98% equal to a further 2088445 cases; of these cases only 182,204 relate to the month of May. This means that after doubling in November and December 2020, in the first 4 months of 2021 we doubled the whole of 2020. All this happens despite the administration of over 34 million doses.
The PCR test epidemic
In the following 5 months the situation calms down, exactly as in 2020. The total increase in cases is equal to only 13.07% for a total of 551661 cases reported, despite another 54 million doses administered and a total of almost 90 million. doses. The comparison of the 2020 – 2021 cases from June to October is surprising: 446233 against 551661. The difference against 2021 is 25%. The correlation with the largest number of tests is quite evident, given that the 2021 average in the same period of comparison is about three times higher than that of 2020, we are talking about 50,000 against 150,000 daily tests. However, if the phenomenon still appears doubtful, it will be enough to consider the real explosion of tests that occurred in the last 3 months of 2021, in particular December, which sees record figures with peaks well over one million daily tests.
We have therefore arrived at the “hot” two-month period, November and December. Although October had passed on the sly, representing one of the months with the lowest number of infections, it could be believed that the above in terms of correlation with anti-flu campaigns may be wrong. However, it is necessary to make a consideration of no small value, useful to explain why the tests have increased tenfold over time while all in all the infections in October did not skyrocket as in 2020.
The problem has to do with who tests in Italy. Italian legislation has extended the use of the green pass in an ever more restrictive manner, forcing non-vaccinated only to continuous tests every 2 days. The vaccinated have been careful not to carry out tests, pretending to be immune until December. Unvaccinated people tend not only against experimental drugs, they are against all prophylaxis drugs, including influenza ones. The October 2020 phenomenon did not occur in October 2021 just because the unvaccinated did the anticovid tests, while the phenomenon was expanding in the vaccinated population. The triggered bomb then explodes at the first check, that is, the Christmas dinner and the end of the year. On both occasions, the vaccinated population also had to resort to swabs in order not to lose the privilege guaranteed by the so called “green pass” and the administration of the unmentionable drug. Yes, you read that right: in Italy, citizens have been strongly conditioned to carry out PCR tests in order to celebrate Christmas with serenity.
In this way it was revealed to the whole country which side were the real infected. The anomalous peak at the end of the year occurs in all European countries, occurring thirteen days later in the Eastern Orthodox countries. In fact, January 13 falls the Orthodox New Year and invariably the infections skyrocket, even in Russia, after weeks of continuous decline.
All this happens in Italy despite the administration of over 111 million doses, of which over 21 in the last two months.
On the death front, which we remember are all positive sars-cov2 deaths, and undead from covid19, here too some surprises.
As already mentioned, the original Wuhan virus disappeared, according to some Italian television virologists around May – June. More contagious but less lethal variants were said in 2020 and then in 2021 we arrive at Omicron which many compare to a severe cold.
The critical phase of deaths is found all in the first 5 months of 2021 which in total counts 51504 deaths, compared to 33415 in the same period of 2020. We recall that those 33415 are attributable to the improvised treatments of the time and which took place in about 2 months . The 51504 must surprise even more then due to the lower lethality of the pathogen, the over 34 million doses of the unmentionable drug, and the now extensive clinical experience gained in the field.
COVID comparison: the fall defeat
Then follows the period June – October, in which we count 5879 dead against 5143 in 2020. So far a defeat without appeal. In October, the Omicron variant is announced, exactly on October 22nd. Cases had been steadily declining for weeks just as deaths had been essentially stable for months.
There is an anomaly to be noted before concluding that it only happens in 2021, in the history of humanity. Cases and deaths of August. Winter flu-like viruses usually in summer are virtually non-existent in Italy. August 2020 reports 337 deaths and 21382 cases. It was said that they were the fault of the summer nightlife, but the deaths were at the lowest of the year, so these were infections prevalent in the younger segment of the population.
August 2021 totaled 1153 deaths in the same population group. Therefore, the one that usually goes on vacation, this time, thanks to more than 78 million cases and tripled tampons, is counted in 184,643 cases. Now the numbers don’t add up at all. We have over 3 times the deaths and 8.6 times the cases. In this period a strange thing happens, multiplying the 2020 cases by three, as if we had done the tests 3 times at the time. Surely we would have found 64,146 cases and still the same 337 deaths. We recall that at the time the virus should have been the worst, and also that the population was not vaccinated. Well the lethality ratio of August 2020 would have been 337/64137 = 0.0052, while thanks to unmentionable drugs 1153/184643 = 0.062. Without a shadow of a doubt a nice gain. Someone will object that the bill is not valid since we have artificially multiplied the 2020 cases by 3. Well, even repeating the division with the official data there is a bitter surprise: 337/21382 = 0.015. These drugs seem to have triggered a parainfluenza pandemic in the middle of summer, never happened in history, with viruses on paper less dangerous than the original strain, which in reality proved 6 times more lethal in the healthiest population group.
The summer passes, the 2020 influenza prophylaxis have lost effect, in the meantime the population continues to be vaccinated against the memory of sars-cov2. The tests are restricted to the only unvaccinated who begin to repeat them. The green pass was in fact initially introduced to facilitate safe international travel. During the summer it was mainly tourists who swab, between the round trip.
After the holidays were left unvaccinated who had not crossed national borders. It was therefore decided to extend the green pass to other areas of civil life, using it as a discriminatory tool.
At this point the vaccinated withdraw from the scene and the spotlights are turned on the unvaccinated.
From the point of view of deaths, the last two months of 2021 totaled 5393 deaths, a not striking number but still slightly lower than the total of the previous five months which was 5879. The relative difference between the months of November and December and just over 100%. In fact, November 2021 counts 1708 deaths while December 3582. If we compare them to the 2020 data, there is a clear difference this time to the advantage of 2021.
In fact, November 2020 counts 16750 deaths and December 17798.
The discrepancy sees a clear reversal compared to what emerged in August 2020. We have gone from a lethality six times greater to a 10 times lower, how is this possible?
There are many factors involved:
- Introduction of monoclonal therapies.
- Prevalence of Omicron cases.
- Endemic spread of the virus and consequent immunization of the unvaccinated.
- Positive attitude towards early home care.
- Greater awareness and use of vitamin supplements.
- Unknown changes in the composition of influenza prophylaxis drugs.
- Less participation in the anti-flu / anti meningococcal / anti pneumovirus campaign
Numerous discriminating factors could be added, for this reason attributing merits to the prophylaxis drugs that allowed the flu pandemic in August appears frankly simplistic and reductionist.
We leave to the reader the interpretation of the last three summary tables that leave, in the light of the facts set out above, very little doubts about the premeditated and planned plot that led us to those results. As initially mentioned the numbers are not the truth. The final result of 2021 which counts around 8,000 fewer deaths than in 2020, has all the flavor of a political adjustment implemented to camouflage the more than 21,000 excess deaths that had been recorded up to October 2021.
Restrictive measures and their effects
Before concluding the 2020 – 2021 comparative exam, it is necessary to comment on the results shown in the table below, which details the monthly variation of the Case / Test ratio, contextualizing the data within a regulatory framework, which unfortunately we have seen repeated throughout the world alike.
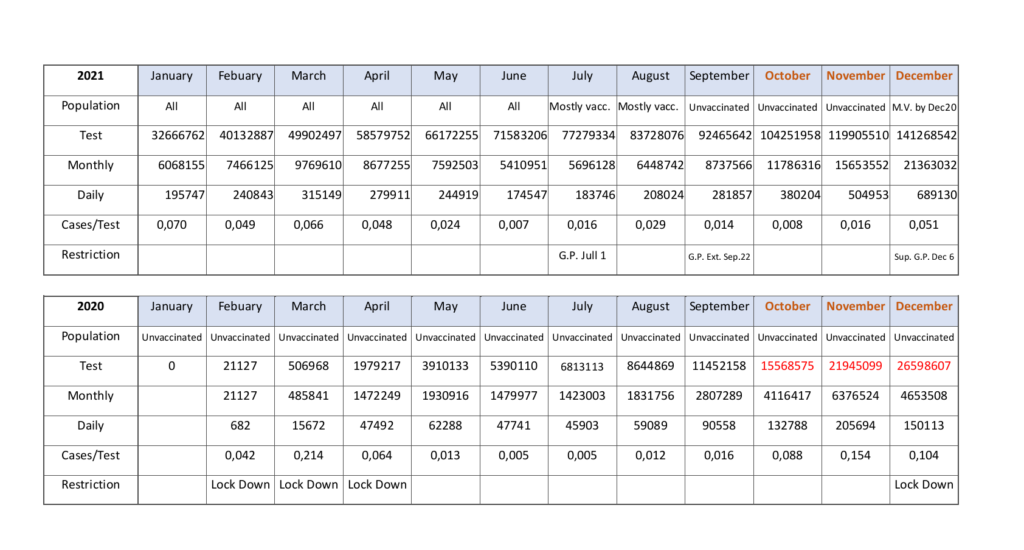
Below is the description of the table shown above
The first line indicates the population groups subject to, or mainly subject to, the health check. The second reports the total number of tests carried out at national level. The third, the monthly total of tests carried out. The fourth is the daily number of tests. This data is no longer relevant than the monthly total, however it serves to better perceive the difference in behavior between the two vintages. The fifth row, referring to the previous tables, highlights the relationship between the number of monthly cases and the number of monthly tests. The sixth line summarizes some of the key measures adopted by the Italian government.
2020 The year of lockdowns and denied treatments
From a first reading of the 2020 printout, we note that the Cases / Test positivity peak occurs in March, and sees a value of 0.214, i.e. 21.4%. Obviously, the first tests were mainly carried out in the nerve centers of the epidemic, so it is not surprising this data, obtained mainly in only two Italian regions, however, with a very small number of monthly tests, just under 486,000, or 20,000 less than the daily tests. of November 2021.
As we can see, the peak therefore occurs in the second month of lockdown, in which it goes from 0.042 to 0.214. Fortunately, in the following month of confinement the worst seems to have already passed and the positivity ratio returns to 0.064, or 6.4%. In the following months, with the arrival of the summer season, we observe the almost total disappearance of the virus. In May the Case / Test ratio is only 1/6 of that of April. The values will remain minimal, without lockdown, until October.
The effect of influenza vaccinations, for the reasons previously mentioned, thanks to these tables, is now even more appreciable. The difference in terms of contagion between September and October is in fact about eight times.
In November the situation appears desperate, the Cases / test ratio, this time at a national level, and no longer local as previously, reaches 0.154, or 15.4%. This will force the government to launch a new “mini” lockdown in December, effectively denying the Christmas and New Year holidays. The measure seems to have some slight effect but despite this and the start of the vaccination campaign on December 27, 2020, in the course of 2021 we will see a slower decline of the phenomenon, compared to what previously occurred starting from May 2020.
Covid comparison: the arrival of variants
With the new year come the unmentionable drugs but also the variants. Experts ensure that they are more transmissible but less lethal than the original virus. New national and international norms also appear on the scene, which still change the social rules. In 2021 the “green pass” arrives, created to facilitate international travel. In Italy this coverage will be arbitrarily extended in a discriminatory way also to “guarantee” safety in public places, in the workplace, even to take advantage of local and interregional public transport. A completely bland measure, as structured in the context of the European Community, will be made “super” in Italy, eliminating the possibility of PCR swabs, both for work and for numerous other activities.
The effect of these mysterious drug solutions immediately does not seem to slow down the circulation of the virus. The results of May 2020 are only equaled in June – July 2021. In July in particular, the Green Pass comes into force, with the declared intention of limiting the movement of people not protected by at least 2 doses of unmentionable drugs. As we can see in the following months, the result was just the opposite. In fact, it goes from 0.007 in June to 0.016 in July, worsening further in August with 0.029, increasing by three times in just 2 months. At this juncture it is mainly the vaccinated who request and exhibit the green pass in every movement and enjoy a wider social mobility.
The 2021 summer holidays leave their mark
Many citizens have experienced the thrill of newfound freedom, many other people have instead found themselves in difficulty, having to face long and expensive quarantines away from home. Mindful of the bitter summer disappointment and frightened by the raging summer pandemic, a large part of the vaccinated population has an opportunity for redemption and the possibility of keeping their parole certificate intact starting from the end of September 2021. The green pass is in fact extended to the whole world of work, both public and private, relegating only the unvaccinated to the obligation to have a tampon every 2 days. The anomaly that we previously highlighted has occurred since October 2021.
Suddenly and inexplicably, during October 2021 the positive test ratio is halved, returning well below the August values. November also sees all the spotlights on the unvaccinated, but also in this case the positivity ratio remains very low, even at the levels of July. Among the unvaccinated, the disease seems to be at its lowest, also because as previously mentioned, they refuse all prophylaxis drugs, even the flu ones. However, in order to build anguish and find the pandemic at all costs, more than 15.6 million tests were carried out in November against just over 5.6 million in July, thus returning to us, with the same contagion, the image of 253,000 cases against 89000. Things that certainly impress the general public of remote-controlled people.
The positivity rate therefore remains constant until close to the Christmas holidays, at which time even the vaccinated are asked for a swab to be able to celebrate indoors or to travel. The peak of positive tests occurs in the last two weeks of December, and is alone enough to quadruple the positivity ratio measured in November. The vaccinated population was now in the open and the victim of a chain reaction of tests, isolations, suspensions of the green pass, which then resulted in a strongly depressing lockdown effect on consumption and on the turnover of commercial activities in real life.
What emerged in this further analysis reveals some aspects, hitherto kept in obscurity. These aspects concern the real effectiveness of the various measures adopted by the Italian government, headed by the banker Mario Draghi, passed off as right, as they are issued in collaboration and under the watchful and infallible gaze of the so-called “science”. Below we list the results achieved by the Italian vaccination campaign and by the measures to combat the pandemic, as defined by the government leaders:
- Effectiveness of lockdowns = marginal or hardly demonstrable effectiveness. Devastating economic and social impact;
- Efficacy of these mysterious pharmacological formulations = major infections in the inoculated population;
- Efficacy of these mysterious pharmacological formulations = increased mortality until October 2021, then the November and December anomaly occurs;
- Effectiveness of the so called “Green Pass” = by virtue of points 2 and 3 it cannot have any use, except to demonstrate that the epidemic is currently in the vaccinated population and that therefore it is precisely the latter that infects the unvaccinated population;
- Herd immunity = nonexistent. The exception of October, November and December is in fact due to the concomitance of other factors.
Covid comparison conclusions
A scientific theory, if it is correct, then it must also be predictive. The forecast must then occur, remaining within the calculated margins of error. With the same precision that has so far characterized true science, we strongly doubt that Wernher Von Braun would have managed to take off the Saturn V, most likely he would have exploded in the assembly phase, exterminating all the technical personnel, including himself. If, on the contrary, Saturn V had miraculously managed to leave Earth’s orbit, applying the same margin of error seen in the Covid19 case, then certainly our brave astronauts would have landed on the sun.
We close our this first survey relating to the covid comparison of these two years, inviting the reader to consider that even today, January 31, 2022, the Italian Statistical Institute ISTAT has not disclosed the data on Italian mortality for the months of November and December 2021. It is too early to draw conclusions, but their delay does not bode well. We hope to wrong this our prediction.