We have already dealt with this issue in a previous article in a rather broad way; this time we will concentrate on trying to highlight the main differences that characterize the main players in the world war currently underway, a sad page of contemporary history. Never as in current times has the word “peace” been so inflated as it is emptied of its founding meaning.
From the end of the Second World War to today, we have always perceived the American and European economies as insuperable pillars of the world economy, however today we realize that despite these two realities can enjoy coins of enormously higher value than the others, in reality, both of these economic ecosystems seem deeply compromised and plagued by incurable evils. Emerging countries once extremely poor and disadvantaged such as China and Russia, in which the blackest hunger suffered in the nineteenth century and up to the first twenty years of the twentieth century did not spare them phenomena of cannibalism, today seem to have found ineffable solutions capable of questioning all Western certainties hitherto considered immutable.
This report you are reading has as its object of study and comparison some fundamental parameters that will help us to portray in an aseptic way the peculiar realities of the four main economic areas involved more or less directly in the frame of this world war: United States, Europe, Russia and China. More specifically:
- GDP
- Public debt
- Tax burden
- Average income
- Minimum social pension
The gross domestic product
Before checking the first comparison parameter it is good to give a brief definition of the meaning of this term:
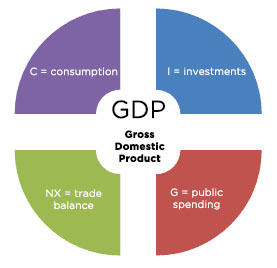
Gross domestic product (GDP) is equal to the sum of the final goods and services produced by a country in a given period of time. It is called internal because it refers to what is produced in the territory of the country, both by national companies and by foreign companies.
This parameter therefore simply indicates the total value of all economic or financial transactions that take place in a country; however, it tells us nothing about the actual well-being of a nation’s population. Let us therefore take this into account in the light of this reflection.
GDP in comparison
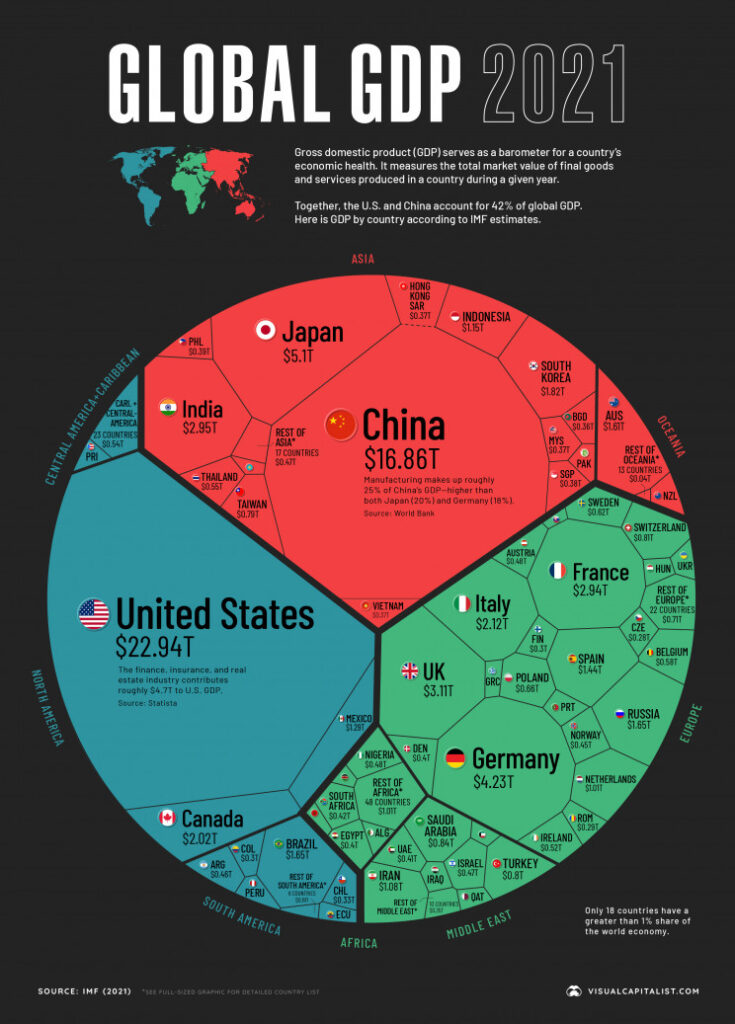
What the International Monetary Fund represents here at the end of 2021 is the world we have left behind. We can barely distinguish Russia, scattered among the other European economies, which on balance seem to outclass it without too much difficulty. Italy even with 2.12 trillion dollars far surpasses Russia at 1.65 trillion. Considering that both spend 2% of their respective GDP on armaments, it is not clear why Russia can count on an effective army of 850,000 men (2 million counting the reservists), while Italy barely counts 98,600.
After this first brief consideration, the resulting ranking is therefore the following:
- United States – 22.94 T
- China – 16.86 T
- Europe – 12.7 T
- Russia – 1.65 T
Objectively, based on these data, one gets the impression that Russia is irremediably disadvantaged and not worthy of particular importance in a possible clash with the Euro-Atlantic bloc. The United States and Europe alone exceed $ 40 trillion in GDP; a possible Chinese contribution to the Russian cause would be useless, it simply did not start. We will see in the following lines if this is really the case.
Public debt
Before getting into the matter, it is appropriate to summarize what we mean when we talk about public debt:
This term indicates the sum of the annual budget deficits. These debts contracted by the public administration towards private or institutional subjects, both domestic and foreign, are offered to the financial market in the form of government bonds. International financial institutions, when the internal national market does not meet the economic needs, may or may not absorb the remaining uncompensated demand, this will depend on the degree of reliability of the offering state and the interest rate applied by it.
This way of conceiving the economy undoubtedly produces two results: on the one hand, the current state fills any budgetary gaps, often malicious, and on the other, it puts its citizens in debt towards supranational entities, putting their decision-making autonomy at risk. . As a result, a vicious economic circle is generated characterized by a progressive increase in the tax burden, which consequently will increasingly compress the purchasing power of the average minimum wage.
In consideration of what has just been described, it seems entirely legitimate to assume that if a country boasts a high debt, let’s say over 100% of its GDP, this data can only mean one thing, namely, that the economic model of that nation is not self-sufficient. and that for some time now has lived above its real possibilities.
Ranking of countries with the highest sovereign public debt in relation to national GDP
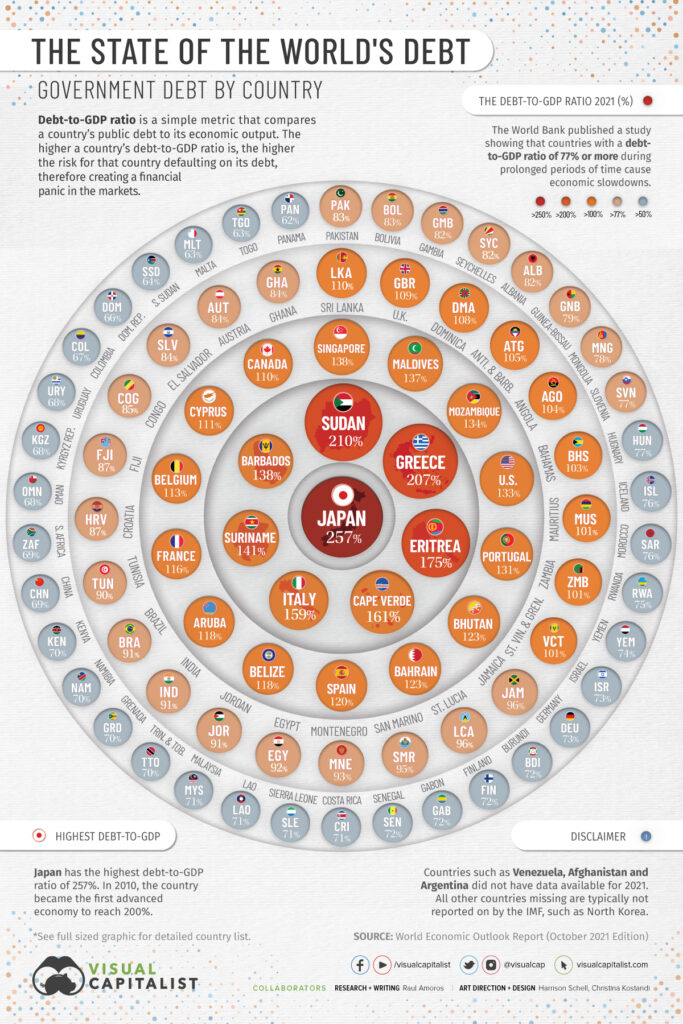
In this infographic produced by the World Bank we only see the debt / GDP percentage ratios reported, however even if this may seem indicative, in reality the real economic value expressed in trillions of dollars is more so.
For now it is worth noting that Japan is at the top of the table, boasting a whopping 257%. In the second group of the damned, Italy appears with its 159%, which allows it to be placed between Suriname (141%) and Cape Verde (161%).
Globally, the Eurozone including the United States are in the second group with an average public debt above 120% (133% for the USA).
China is on the right side of the third group, credited with 69%, while Russia… is not classified. The Russian public sovereign debt in 2021 was estimated at around 12% of the national GDP, it is expected that in 2022 it could reach 20% due to the ongoing war.
There is debt and debt
It should be noted that there are different forms of public debt. The countries at risk of default are those with a high Debt / GDP ratio but mainly the composition of this debt counts, i.e. if it is foreign debt, in the hands of international private funds or foreign state banks, or it is internal debt, in the hands of the citizens of the nation, and this in turn can be divided into sovereign debt, or contracted by the public administration, and private debt, which essentially concerns citizens and companies. The table above refers to sovereign debt; by total debt, on the other hand, we mean the sum of the three components. This is generally very difficult to find, and hardly ever advertised. The case of Japan is emblematic because, although its debt reaches 257%, it is almost entirely made up of internal debt, something quite different, for example, from the US debt which is 1/4 in foreign hands. China and Japan each hold about $ 1.1 trillion of the more than $ 7000 total.
Below we report the real economic value of the debts in question according to what we were able to find online:
- USA – 28.5 T Deb tot = 89 T equal to 397% of GDP, of which 133% Sovereign Deb, here you can see it in real time
- China – 10.7 T Total Debt = 46T equal to 287% of GDP, of which 67% Sovereign Debt, 160% Corporate Debt and 60% Private Debt
- Europe – 12.7 T 100% of GDP
- Russia – 0.15 T Or 150 billion dollars, of which 89 in sovereign debt. Some estimates put the total debt close to 18% of GDP
- Italy – 3.0 T
Looking at these numbers, it can be easily understood that it is not enough to be first in the ranking of world GDP to be able to define a winning economic model to be imitated. From this comparison, Russia appears to be the only economy that is truly functioning and that lives by remaining well below its capabilities.
As far as China is concerned, we highlight that most of its total debt is linked to the real estate sector, it is essentially private mortgages, therefore the state one remains largely under control; however we note, as well as in the US economy, that the amount of non-sovereign debt is almost overwhelmingly overwhelming compared to this, and this directly reflects the level of indebtedness of businesses and ordinary citizens. This component is practically reversed in the Russian system which sees sovereign debt occupy about 60% of the total debt and the remaining 40% equally divided between government agency and private corporate debt.
The effects of these economic systems on real life
Let us now analyze how the effects of these economic systems are reflected in the real life of people by taking into consideration the tax burden imposed on their respective populations.
Tax burden
In order for the economy of a nation to be defined as healthy, the tax burden exerted on citizens must be minimal, and the services offered must be of high quality. If the opposite occurs, that is, high tax rates and poor social services, obviously there is something wrong. Let’s start from the American situation by providing some fundamental indications.
The United States adopts a tax regime differentiated by income brackets, however the average tax revenue is around 21% (from 10% to 37%). As for the European Union, tax revenue varies from 23% in Ireland to 48.4% in France, so we can safely establish 40% as a reference value. Unlike US progressiveness, China instead adopts a fixed tax rate of 25% applied to all foreign or domestic companies. Also in this case there are exceptions for ordinary taxpayers to whom a rate of 17% is applied. The total tax revenue for 2021 was 21%. Russia has an articulated tax system, on a federal basis and mainly sees three tax rates, 13% on employee income, 20% on business income and finally, from 20 to 40%, based on turnover. for self-employment income. In any case, the Russian tax revenue, in total, does not exceed 20%.
Based on these data, which are extremely summarized and certainly not exhaustive, it would seem without any doubt that the economic systems currently most in difficulty are precisely those of the West, especially the European one. It would seem that decades of fiscal strangulation have not led the European states to the long-awaited reduction of their respective public debts, on the contrary they have increased them. Despite the growth of our current expenses, we have not succeeded in producing anything but backwardness and a progressive impoverishment of the masses, after all weakening the purchasing power of average wages, can only cause indebtedness. In a few decades, starting from the roaring fifties, we have gone from the decently self-sufficient mono-income family to the modern family in which two salaries do not guarantee full support, but on the other hand, in the best of cases, allow us to bear the burden of mortgages. thirty years old.
Average income
Let us now address this topic which is hardly presented to public opinion by first giving a brief definition. According to the OECD:
Average wages are obtained by dividing the national wage bill by the number of workers in the total economy, then multiplied by the ratio between weekly working hours for full-time workers and weekly hours for all workers.
Two limitations of this type of analysis should be emphasized:
- All earnings deriving from undeclared or otherwise unregulated work are excluded from this figure.
- It divides the incomes of the richest even among the poorest, of which it does not specify the percentage ratio with respect to the total population, in practice it does not tell us how many poor people exist in that nation.
Obviously, the resulting data, expressed in dollars or euros, can be confusing for the reader, especially when analyzing countries outside our economic system, such as China and Russia. It is very easy to fall into the error of believing that having more dollars is enough to have greater purchasing power. This is not entirely wrong when you move from a rich country to a poor country, however when you return home, those super powers of enchantment disappear. Let’s try to present a short list of the average annual incomes received in the countries in question:
- United States – 56310 $ (51242 Euros, or 4270 Euros per month) link
- Europe – from 3600 Euro (Albania) to 67500 Euro (Switzerland) per year – 35550 European average or 2962 per month link
- China – 10766 Euro (74208 CNY, or 6184 CNY per month, equal to 897 Euro) link
- Russia – 4257 Euros (403200 Rubles or 33600 rubles per month, about 354 Euros) link
- Italy – from 15000 to 25000 depending on the region (national average equal to 2180 Euro or 1816 Euro per month) link
Considering that the average per capita income in Russia is about 5 times lower than the Italian one and 12 times lower than the American one, it would seem that in this nation people live in hardship. However, judging by the standard of living of the Moscow inhabitants, and by the splendor of their shopping centers (see below) or theaters, Moscow today appears to be a city at least equal to the best European capitals at least as regards the commercial and public services, for example also its famous metro.


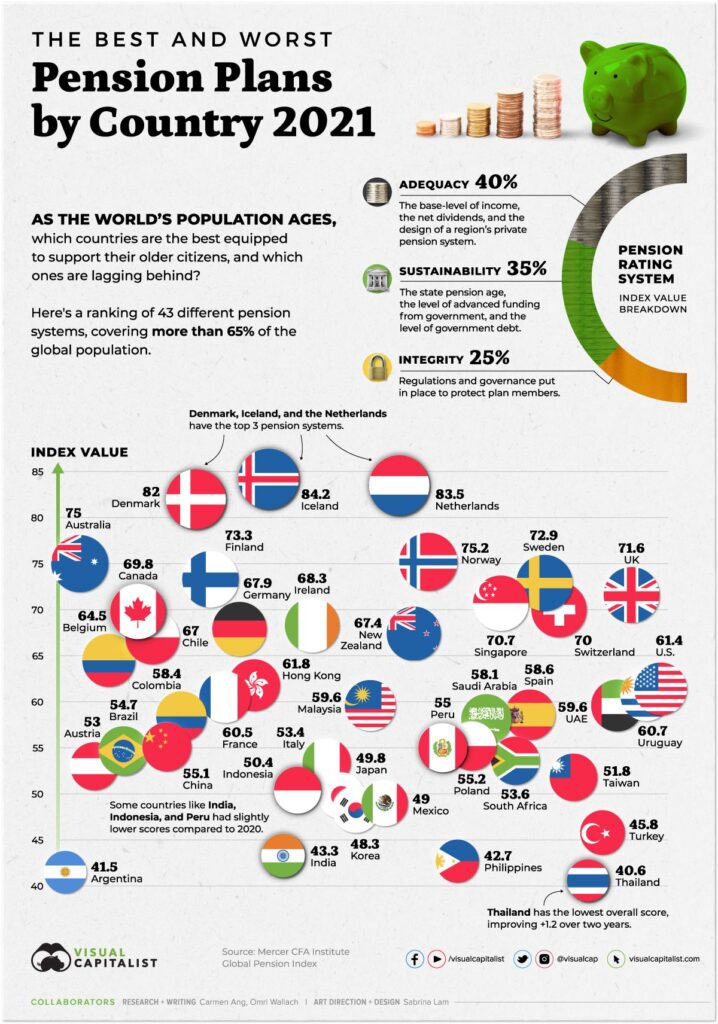
At this point all that remains is to check one last fact so that we can try to understand which of the economic models proposed is really the most efficient at the moment, that is the value of the minimum social pension in the respective camps. Before continuing, however, we must always keep in mind that the tax pressures of each nation always weigh on the average incomes listed above.
Social pensions
Social pensions are not those of seniority of service, but are dedicated to all those who, having not accrued a sufficient amount of contributions over the years, find themselves unable to provide for their own sustenance due to age limits. These pensions are therefore very close to the minimum survival limit, and are generally below this if you are not lucky enough to own a home. Suffice it to say that in Italy, where the rent of a mini club in the city costs no less than 500 Euros per month, the social pension amounts to 460.28 Euros. This figure is actually even higher than the average Russian salary. Considering that it consists of 13 months, our social pension amounts to 5983 Euros, against the 4257 of the average Russian salary, so it would be a high level salary in Russia to spend there. So let’s see in more detail what the situation looks like, reporting below the average values for each of the countries in question.
- United States – $ 600 social pension, $ 1600 retirement pension. (Varies by income)
- Europe – 400 Euro minimum pension, 1500 Euro maximum pension. (Average values)
- China – The Chinese pension scheme is contributory in nature. It provides for non-state workers an income equal to 35% of the last salary received in business, while for state workers the income is equal to about 90% of the last salary received. Therefore, if the average Chinese income is equal to 10,500 Euros per year, or 875 Euros per month, the minimum pension will be equal to 306.35 Euros or 2,164 CNY.
- Russia – 6242 (69 Euros) Rubles Social pension, 18,500 Rubles (204 Euros) Average pension.
In the case of Russia, the social pension is abundantly insufficient, therefore a different supplementary share is provided for each region of the country, in the case of Moscow it amounts to 21133 rubles (133 euros).
For both China and Russia, the retirement age is very early, 50 for women and 55 for men until a few years ago. In recent years, also thanks to the covid19 emergency, the retirement age has been moved forward by roughly 5 years in both countries.
This topic, as you will guess, is too broad to be addressed here, however we can underline a fact to complete the discussion, namely that the average retirement age in Europe is 64 years and 4 months for men and 63 years and four months for women (for Italians it takes 2 more years for both men and women), while in the United States it is 67 years. Retirement income in Russia is unrelated to any concurrent work activity, while in Europe and the United States working as a retiree involves a reduction in the pension benefit.
Conclusions
In this long overview we have seen that even the seemingly richer countries are by no means exempt from significant economic problems. These appear to be structural and conceptual in nature, and fundamentally unsolvable.
Having examined all the points initially prefixed, we can sum up by directly comparing the two models that have proved to be antithetical in many respects, namely the United States and Russia to try to understand which of the two is better placed:
GDP Public debt – Average income / month – Tax burden – Minimum pension
USA 22,4T 130% (28.5T) 51242 Euro / 4270 Euro 23% 546 – 1456 Euro
Russia 1,6 T 18% (0,15T) 4257 Euro/ 354 Euro 20% 69 – 204 Euro
Beyond the astronomical American GDP, what is most striking is the great distance between the minimum pension and the average monthly income which sees the American economy at a marked disadvantage, despite the fact that the latter resorts to a higher tax burden. The question of public debt, which Americans normally solve by printing money out of thin air, is simply embarrassing, especially since the two populations do not differ enormously in the number of inhabitants (331 million for the Americans 146 million for the Russians).
What seems clear instead is that the American model is enormously and unnecessarily expensive, since the colossal economic effort they put up, to the test of the facts, does not produce a proportional gap to their advantage both in terms of well-being and social equity. in terms of absolute military strength.
In our opinion, the evil affecting the United States, Europe and China is their excessive industrialization. Industries consume large quantities of energy resources and raw materials. The industrial drive towards profit and capital magnifies the cities which in turn enormously increase consumption and land use. Therefore, on the one hand, the need for these economic systems to weave a predatory market with inevitably expansionist aims is triggered, which tend to relegate a certain number of vassal nations to a state of poverty, on the other hand it certifies at the same time the absolute dependence of predators from the latter. The wealth of the few, in essence, is based on the necessary poverty of the many.
In reality, Russia has never put too much emphasis on its industrialization, except in the Soviet period, it enjoys total independence in both food and energy and can afford to buy external goods by paying in raw materials. Its non-exasperated economic model has an undeniable strength in the relationship between population and arable land, unlike other countries that are far too crowded and less habitable. The relationship between exploitable territory and the number of sustainable citizens in complete autonomy becomes anti-economic when certain levels of urbanization and industrialization are exceeded. This is evident in Europe, in the very crowded Japan, in the Great China rich in deserts, and in the United States, inhabited mainly on the coasts, and also largely arid and full of inhospitable regions.
The war we are witnessing is actually revealing all the political and economic limits of Western models; he is putting the importance of simple things at the center of our attention, which previously seemed obvious to us and to which we did not give importance, such as peace, individual freedom, wheat, work. The sunset of a cynical and immoral economy that we have known now seems to be upon us, we hope that what will come after this cataclysm will bring people together in a new world, less exasperating and ethically healthier.
1 comment
[…] World war escalation: economies compared […]